Food-Delivery Statistics
Dotlas maintains a high-frequency and near real-time measurement dataset that captures estimated delivery times and fees charged by restaurants on food delivery platforms across all observable neighborhoods in a city.
For each restaurant, we simulate a customer located in various neighborhoods and collect:
- Estimated Time of Arrival (ETA)
- Delivery Fee charged by the platform
- Neighborhood of the simulated customer location
- Time of Day (breakfast, lunch, dinner slots)
This dataset enables powerful analysis of delivery experience across:
- Brands and cuisines
- Time slots and service load
- Neighborhoods and zones
- Delivery aggregators and pricing strategies
Unlike static attributes, these signals reflect dynamic platform conditions including batching, traffic, surge pricing, and operational efficiency.
Use-Cases
- Average delivery times per brand, cuisine, or zone
- Fee competitiveness across platforms and locations
- Identify underserved neighborhoods with high demand but slow delivery
- Compare delivery performance across time of day
- Benchmark competitor SLAs by area
- Inform fulfillment strategy and ghost kitchen expansion
- Coordinate promo timings to match fastest service windows
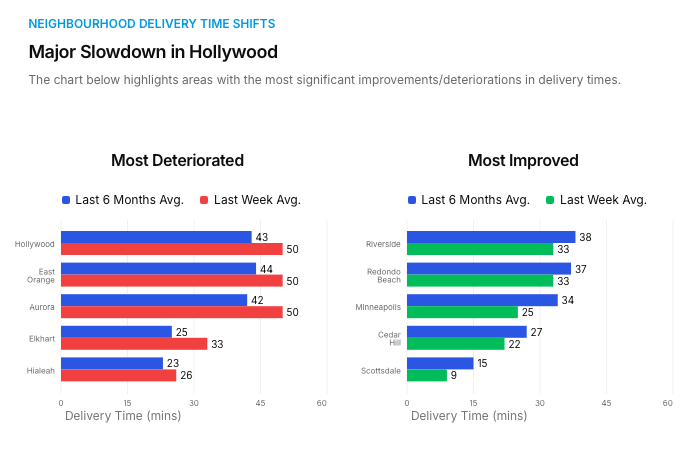
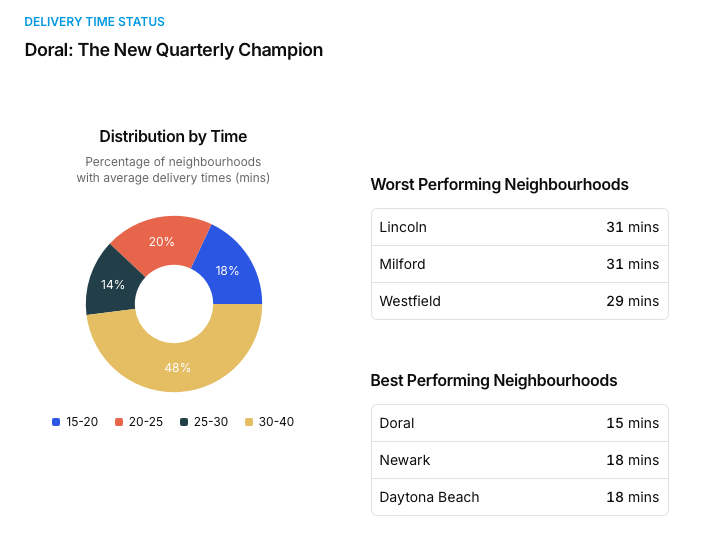
Sample Dashboards or Analyses reflective of this data:
Data Dictionary
Each record represents the delivery stats of a restaurant to a specific neighborhood at a given time of day.
| Column Name | Data Type | Description |
|---|---|---|
| restaurant_id | string |
Unique Dotlas-assigned identifier for the restaurant |
| brand_id | string |
Dotlas-assigned brand/group the restaurant belongs to |
| neighbourhood_id | string |
Dotlas-assigned ID for the neighborhood receiving the delivery |
| city | string |
City in which the neighborhood and restaurant are located |
| delivery_eta_minutes | integer |
Estimated delivery time to this neighborhood (in minutes) |
| delivery_fee | float |
Delivery fee charged for the given route and time |
| currency | string |
Currency of the delivery fee |
| delivery_service | string |
Platform from which the ETA and fee were collected (e.g. Talabat, Jahez) |
| meal_period | string |
Time window when measurement occurred: breakfast, lunch, dinner |
| snapshot_at | timestamp |
Timestamp when the ETA and fee were recorded |
Delivery Radius Data Product
For spatial modeling of restaurant reach, Dotlas also offers a polygonal dataset that maps the delivery footprint of each restaurant by time of day and platform. The Delivery Radius dataset contains per-restaurant service areas that define where delivery is offered (and where it isn't), based on real-world ETA coverage.
Each polygon includes:
restaurant_id,meal_period,delivery_service, andgeometry- Areas where ETAs and fees are actually reported by the platform
This allows visualization of:
- Reach expansion or contraction by daypart
- Delivery zone gaps and opportunities
- Platform-specific coverage differences